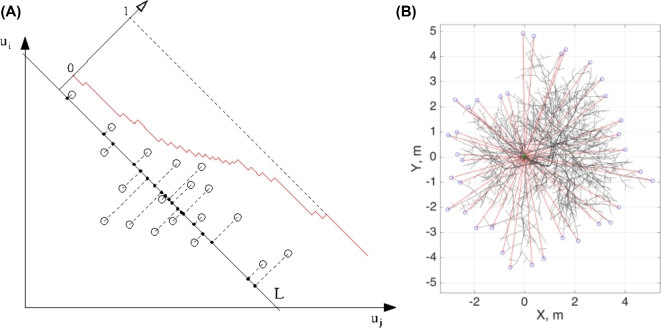
Figure 9:
Distribution tomography of the structural data sets (A) and classical metric for the crown spread (B). (A) Data points in U (projected here for simplicity onto the (ui, uj) plane, i.e., in 2D) are used to construct the projection onto a line L. Cumulative empirical distribution is calculated along L (red). Only one line is shown. (B) Top view of a tree: spokes (red) emanate from the ground segment (green), extending up to the most distant points (blue).

