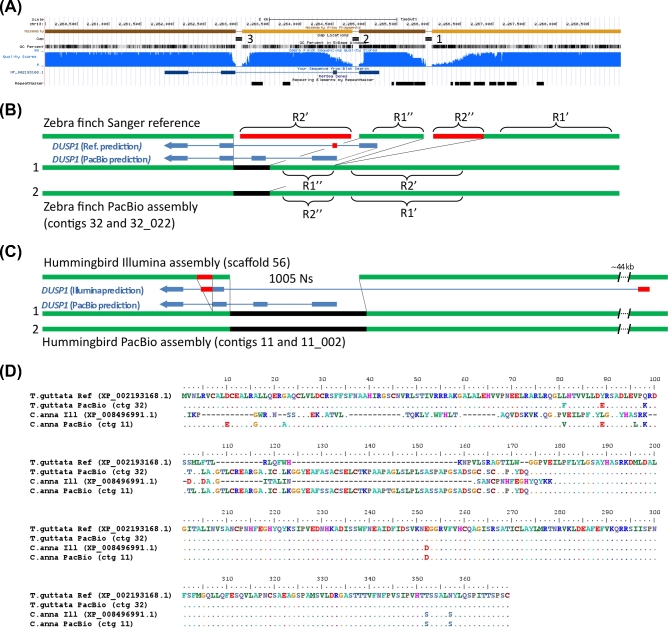
Figure 4:
Comparison of DUSP1 assemblies. (A) UCSC genome browser view of the Sanger-based zebra finch DUSP1 assembly, highlighting 4 contigs with 3 gaps, GC percent, nucleotide quality score, Blat alignment of the NCBI gene prediction (XP_002193168.1, blue), and repeat sequences. (B) Resolution of the region by the PacBio-based zebra finch assembly, filling the gaps (black) and correcting erroneous reference sequences in repeat regions (red) and gene predictions (blue). Panels (A) and (B) are of the same scale. (C) Resolution and correction to the hummingbird Illumina-based assembly with the PacBio-based assembly (same color scheme as in (B)). (D) Multiple sequence alignment of the DUSP1 protein for the 4 assemblies in (B) and (C), showing numerous corrections to the Sanger-based and Illumina-based protein predictions by both PacBio-based assemblies.

