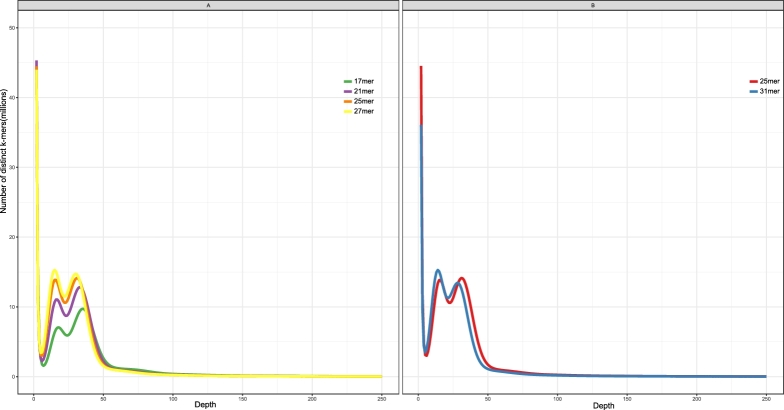
Figure 2:
k-mer analysis of the R. delavayi genome. (A) Histograms of k-mer frequencies in the clean read data for k = 17 (green), k = 21 (purple), k = 25 (orange), and k = 27 (yellow) by KmerFreq. (B) Histograms of k-mer frequencies in clean data for k = 25 (red) and k = 31 (blue) by jellyfish. The x-axis shows the number of times a k-mer occurred; e.g., the peaks near x = 31 indicate the number of k-mers that occurred 31 times in the data.

