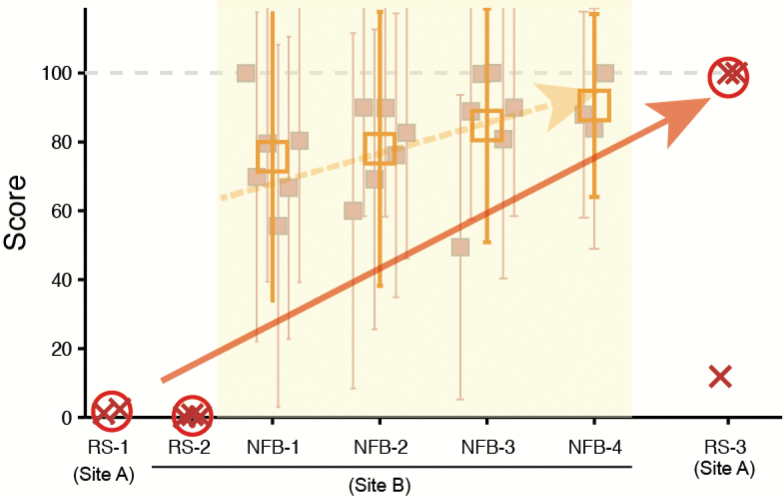
Figure 5.
Neurofeedback-induced change of functional connectivity (FC) toward the neurotypical pattern in a case of adult high-functioning autism spectrum disorder (ASD). The graph shows the feedback scores during the training sessions (blank squares and error bars) and the outputs of the ASD biomarker (Yahata et al., 2016) using the resting-state FC data collected before (i.e., RS-1 and RS-2) and after (i.e., RS-3) the neurofeedback training (x signs). The open circle denotes the mean output of the ASD biomarker across the three rs-fcMRI sessions conducted in a single day. Although the linear weighted summation of FCs in the ASD biomarker ranged between 0 (neurotypical pattern) and 1 (typical ASD pattern), the value was fed into a mathematical transformation involving a sigmoid function, such that the output of the ASD biomarker ranged between 0 (typical ASD) to 100 (neurotypical). In each training day, there were 6 runs (filled squares and error bars; except for three runs in the final day), each of which had 10 trials. Note that, whereas the outputs of the biomarker had remained close to 0 before the training, the resting state FCs exhibited the neurotypical pattern at least twice out of 3 scans in the posttraining, which was acquired 3 weeks after the training.

