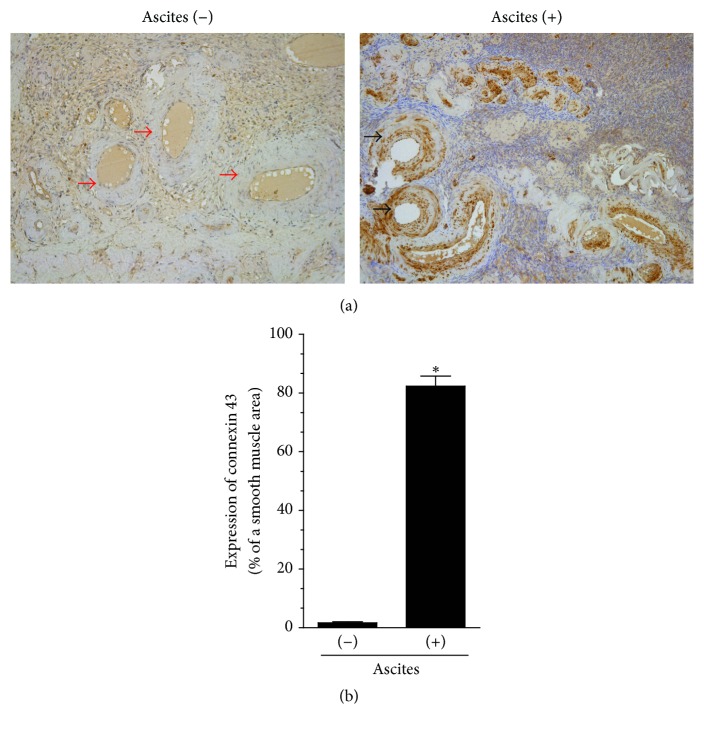
Figure 4.
Microscopic evaluation of the expression of connexin 43 in vascular smooth muscle cells within serous ovarian tumors that developed in either the presence or absence of malignant ascites. Panel (a) shows the representative results of connexin 43 staining (the black arrows indicate a positive reaction; the red arrows indicate a negative reaction). Panel (b) shows the results of the quantification of the brown-stained area reflecting the presence of connexin 43. The results are expressed as a percentage (%), and the whole area of the vascular smooth muscle cells is considered to be 100%. ∗P < 0.05 versus ascites (−). The results derive from an analysis of tumors from 6 different patients per group and are expressed as mean ± SEM.

