
FIGURE 1.
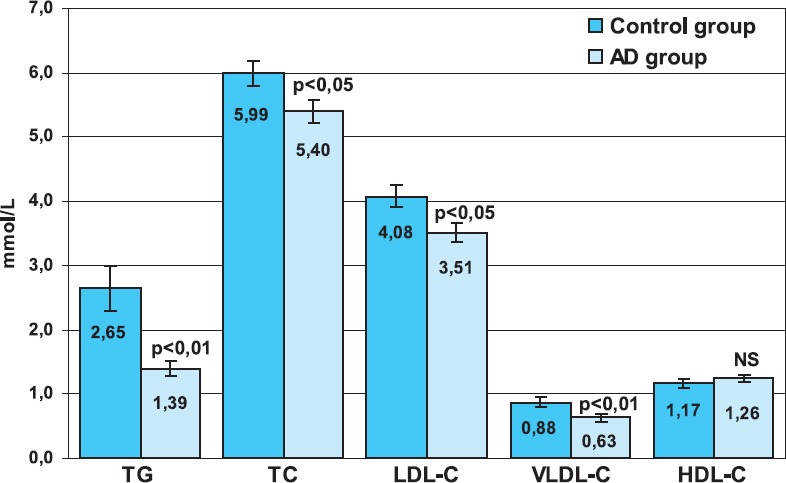
Mean serum lipids concentration in the control (C) and Alzheimer’s disease (AD) group. Bars show means and error bars show S.E.M.; TG - triglycerides, TC - total cholesterol, LDL-C - low-density lipoprotein cholesterol, VLDL-C - very-low-density lipoprotein cholesterol, HDL-C - high-density lipoprotein cholesterol, NS - not significant.