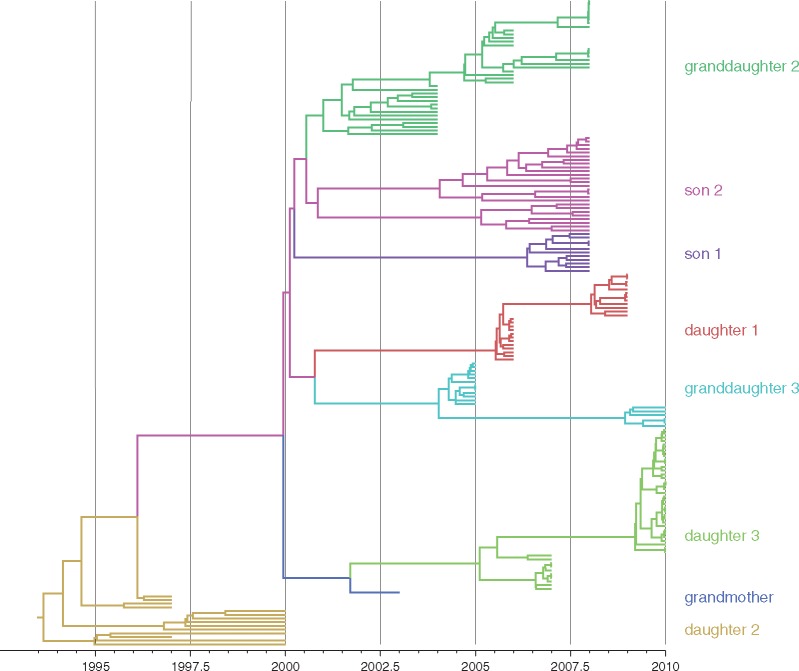
Figure 1.
HBV phylogeny estimated from the transmission chain data under the ‘unconstrained’ model. We refer to Table 1 for details on the model setup. To facilitate identifying incompatibilities with the transmission history, we colored the tips and internal branches using a discrete asymmetric trait analysis with the patients as discrete states (Lemey et al. 2009; Edwards et al. 2011). The patient-color links are as indicated next to the tree.

