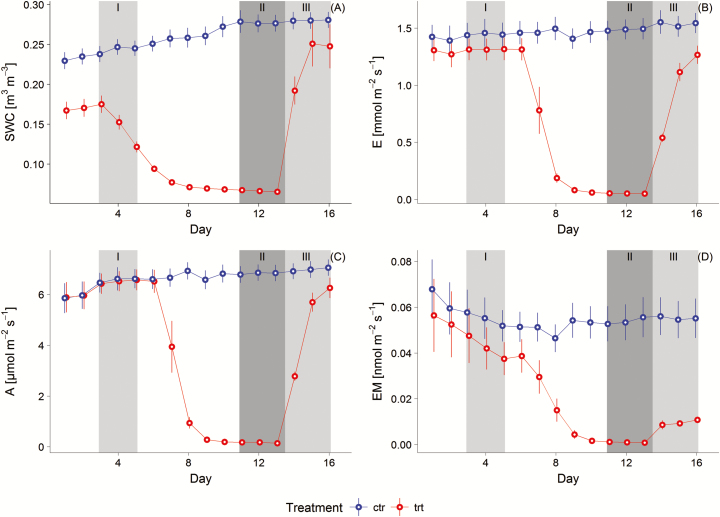
Figure 1.
Mean daytime (1100 and 1200 h) measurements of (A) SWC, (B) net photosynthesis rate A, (C) transpiration rate E and (D) 1,8-cineole BVOC emission rate EM – light/temperature corrected by the Guenther 97 algorithm (Guenther et al. 1997). Mean and standard error are given for four control (ctr) and four treated (trt) trees of the two repetitions. The three periods (I to III, see also Table 1) are split into phase I non-stressed (light grey, Days 3 to 5 noon), phase II fully drought stressed (from Day 11 afternoon to Day 13 noon) and phase III re-watering (light grey area, Days 14 to 16).

