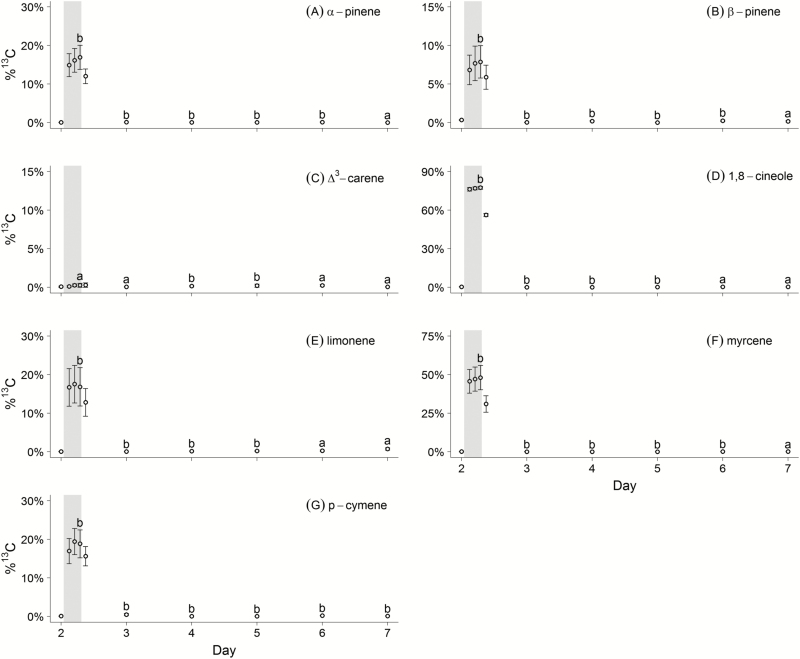
Figure 2.
Mean %13C for each compound (see Methods for calculation of each compound) for (A) α-pinene, (B) β-pinene, (C) Δ3-carene, (D) 1,8-cineole, (E) limonene, (F) myrcene and (G) p-cymene of all trees before (Day 2, 1200 h), during the 13C labelling (grey band, Day 2, 1300 h until 1800 h) and after labelling (Days 3 to 7, 1200 h). Error bars represent the standard error. Small letters show the result of a paired Wilcoxon signed-rank test by comparing Day 2 at 1200 h (non-labelled) with the 1700 h (Day 2, labelled) and the post-labelling 1200 h samples (Days 3 to 7). Letter ‘b’ indicates significant group differences for each comparison (P < 0.05), while letter ‘a’ corresponds to non-significant differences, thus pre-labelling fractions.

