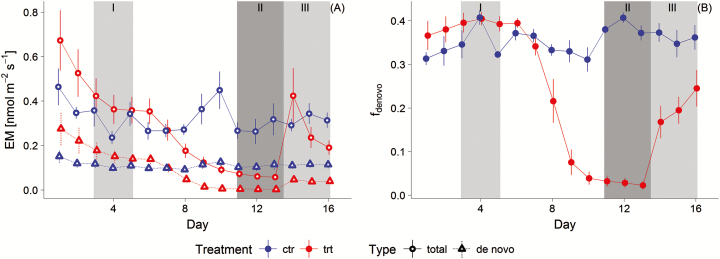
Figure 4.
(A) Mean daytime (1100 and 1200 h) de novo (triangle) and total (circle) emission rates (EM) of total sum of compounds (black bar) at each day and each group (trt = treatment (N = 4), ctr = control (N = 4)) are displayed. (B) Estimated mean fde novo by the non-linear model for both groups. Error bars represent the standard error.

