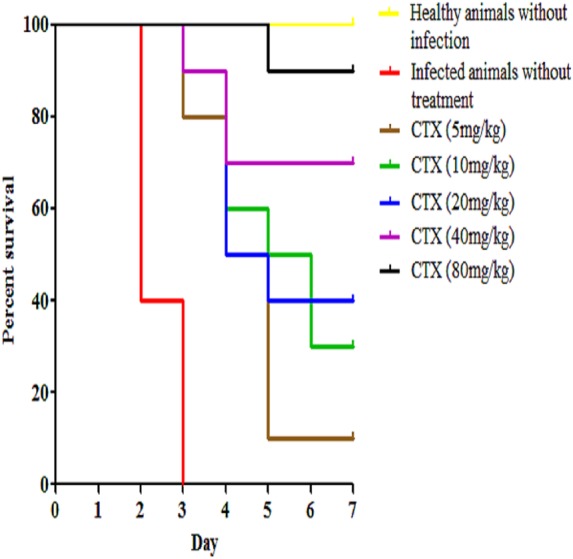
Figure 6. Survival curve of infected mice treated with ceftriaxone (CTX).

Kaplan–Meier with log-rank test (Mantel-Cox) was used to perform the statistical analysis for all of the treated group and the untreated control.

Kaplan–Meier with log-rank test (Mantel-Cox) was used to perform the statistical analysis for all of the treated group and the untreated control.