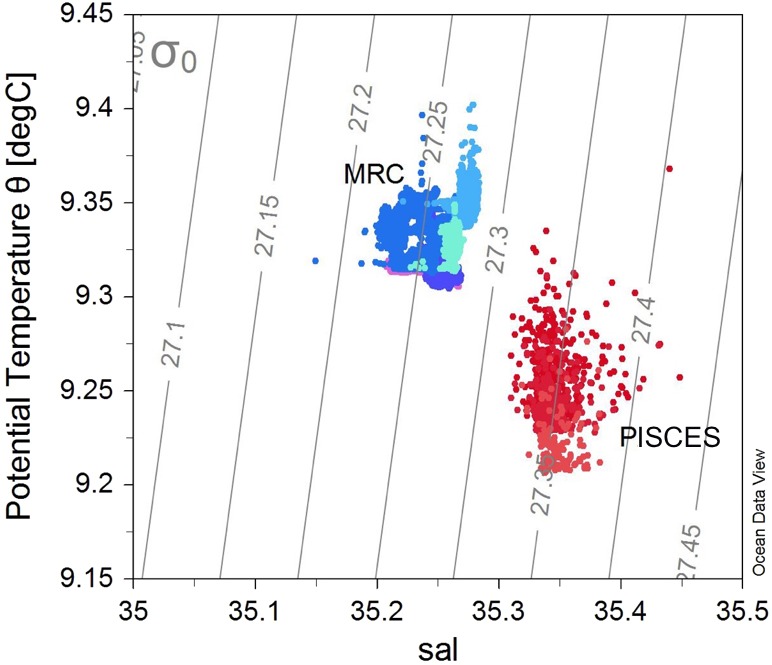
Figure 6. T–S plot showing the potential temperature vs salinity (sal), with isopycnals (grey lines) for all the ROV transects.

Colours represent the different transects (and sites): blue colours show the transects within the Mingulay Reef Complex (MRC) while red colours show the transects within the PISCES areas (PA).
