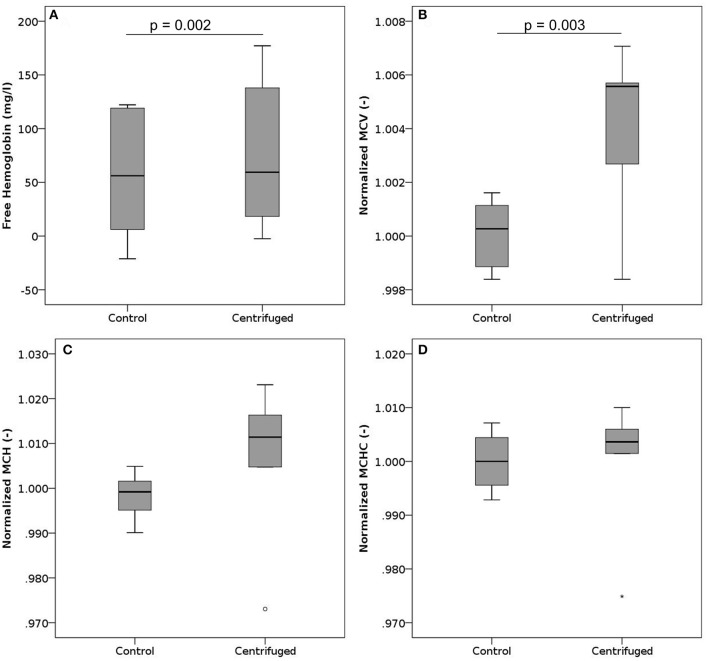
Figure 4.
Free hemoglobin, MCV, MCH, and MCHC after centrifugation. Blood samples where centrifuged at 900 g. (A) Free hemoglobin after centrifugation for 5 or 10 min. The black line indicates the median, while the mean values are 61 mg/l and 79 mg/l for controls and centrifuged samples, respectively. n per group = 12. (B) Normalized mean cell volume after centrifugation for 5 min. Reported values have been normalized by the mean of the corresponding control measurements. n per group = 6. (C) Normalized mean corpuscular hemoglobin after centrifugation for 5 min. Reported values have been normalized by the mean of the corresponding control measurements. n per group = 6. (D) Normalized mean corpuscular hemoglobin concentration after centrifugation for 5 min. Reported values have been normalized by the mean of the corresponding control measurements. n per group = 6.

