Figure 4.

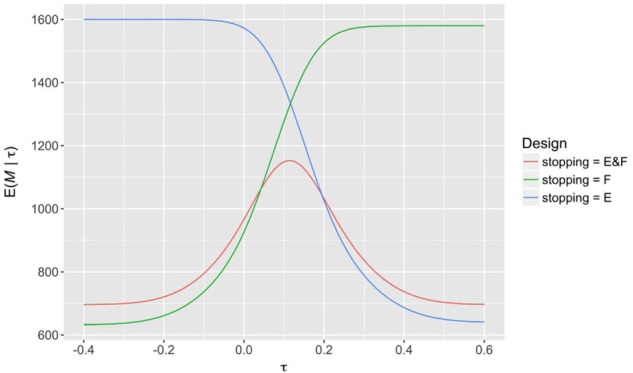
The expected sample size curves of several sequential SW-CRT designs with different possible allowed reasons for early stopping are displayed for Scenario 1. Each design has , with when required.

The expected sample size curves of several sequential SW-CRT designs with different possible allowed reasons for early stopping are displayed for Scenario 1. Each design has , with when required.