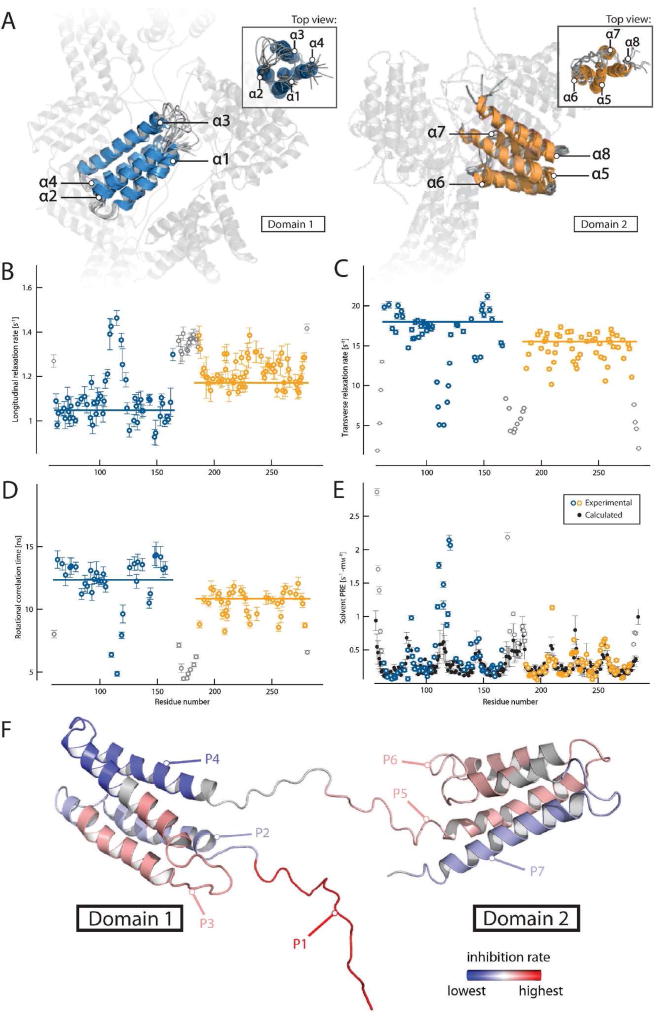
FIG 1.
Structure of Phl p 5a and domain mobility. (A) Overlay of the 10 lowest energy models of both structured regions (left: domain 1 in blue, right: domain 2 in orange) showing the unstructured domain-linking loop and counter-domain in transparent form. Labeling of the helices is performed in a sequential manner starting at the N-terminal domain. Backbone dynamics of Phl p 5a are shown as 15N longitudinal relaxation rates (B), transverse relaxation rates (C), overall correlation times (D) and solvent PRE (paramagnetic relaxation enhancement) rates (E), experimental values of structured domains in color, flexible termini and linker in grey, calculated values in black, outliers may arise from high solvent exposure and increased hydrogen exchange with water). Values are plotted as a function of residue number and trimmed mean values of structured regions are indicated by horizontal bars. (F) Position of peptides within the Phl p 5a structure. The regions of the peptides are labeled in different colors using a linear gradient ranging from red, displaying the highest average inhibition rate of IgE binding, to blue, with the lowest inhibition. Gray regions were not part of the study. The flexible N-terminus containing P1 was modeled into the structured part of the molecule.

