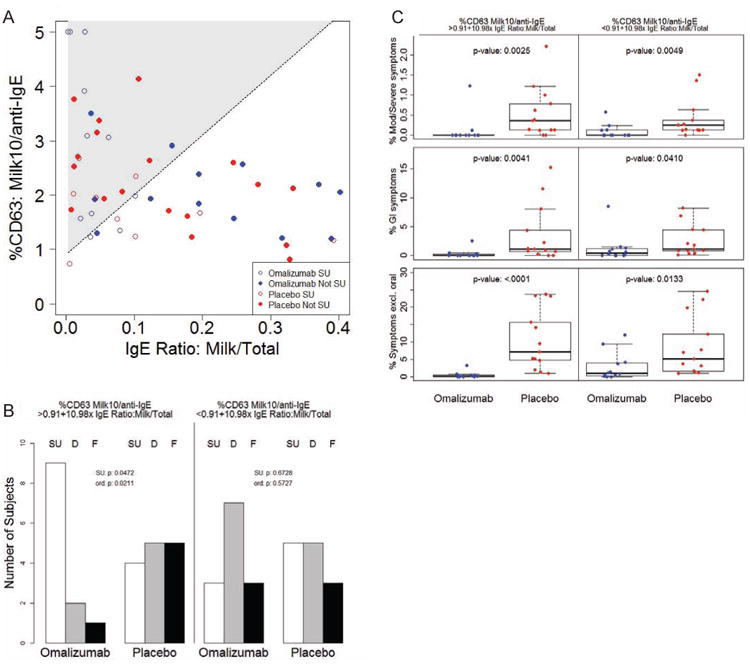
Fig 7.

A Baseline values of the ratio of %CD63 to milk stimulant concentration 10 μg/mL over %CD63 to anti-lgE (%CD63: Milk10/anti-lgE) were evaluated in relation to the baseline milk IgE/total IgE ratio (IgE Ratio: Milk/Total) in a logistic interaction model. Shaded area indicates region of numerically positive treatment estimate in terms of likelihood of achieving SU. Subjects who achieved SU are shown in open points; those who were desensitized only or failed are depicted in closed points (Not SU). B Number of omalizumab or placebo subjects whose baseline biomarker values fell above (%CD63 Milk10/anti-lgE > 0.091+10.98× IgE Ratio: Milk/Total) or below (%CD63 Milk10/anti-lgE < 0.091+10.98× IgE Ratio: Milk/Total) the line of positive effect described in A who achieved sustained unresponsiveness (SU), were desensitized only (D) or failed (F). P-values for a difference in SU (SU. p), and for a difference in ordinal outcomes (SU/D/F; ord. p) are presented. C Percent of MOIT doses that led to moderate-severe (Mod/Severe) symptoms, GI symptoms, or any symptom excluding oropharyngeal (Symptoms excl. oral) over the course of MOIT in the two subsets of subjects described in B. P-values are indicated in the graphs.
