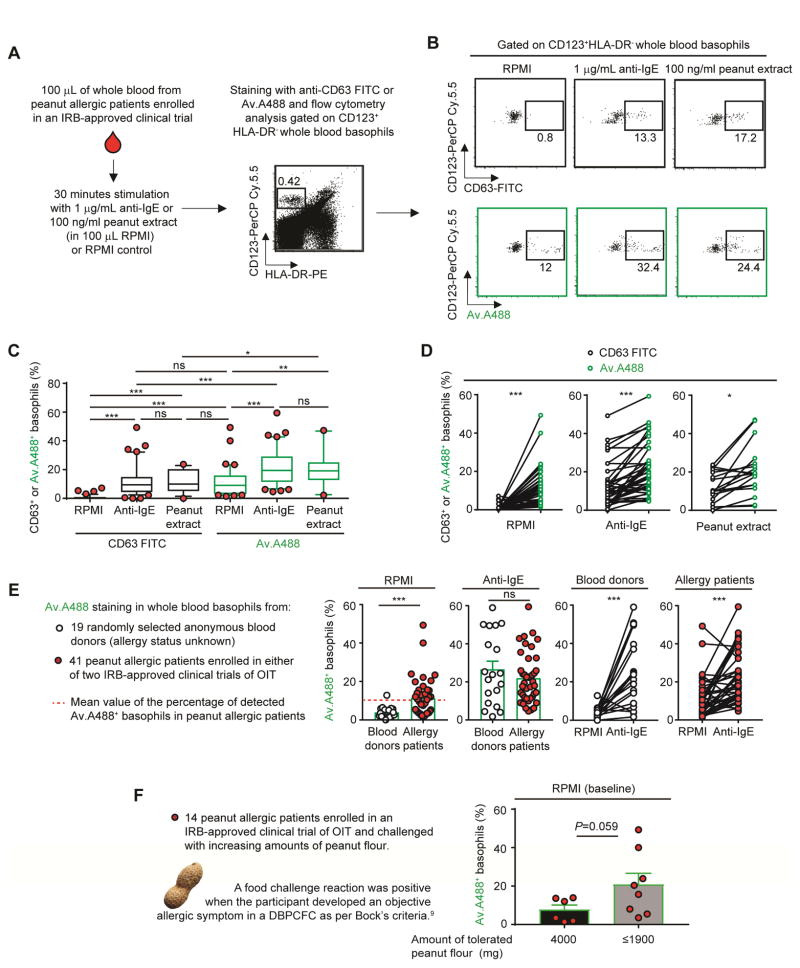
Figure 2. Using fluorochrome-labelled avidin to monitor the status of basophil activation in whole blood of peanut allergic patients.
(A) Protocol for assessing basophil activation by flow cytometry in whole blood.8 (B) Representative dot plot of HLA-DR−CD123+ basophils incubated with RPMI, anti-IgE or peanut flour and stained with anti-CD63-FITC or Av.A488. (C) Percentage of CD63+ (black) or Av.A488+ (green) basophils after RPMI or anti-IgE or peanut extract challenge in 41 peanut allergic patients. Lower/higher 5% values are plotted as individual dots. Boxes extend from the 25th to 75th percentiles and whiskers represent 5th and 95th percentiles. Bars indicate medians. (D) Comparison of CD63+ (black) or Av.A488+ (green) basophils after RPMI (left) or anti-IgE (right) for each patient. Linked dots represent results from the individual patients. (E) Percentage of Av.A488+ basophils in 19 anonymous donors (open) versus 41 peanut allergic patients (black). (F) Y axis: Percentage of Av.A488+ basophils after RPMI (baseline) incubation in 14 peanut allergic patients in the POISED oral immunotherapy (OIT) trial that were challenged with increasing amounts of peanut flour; X axis: amount of tolerated peanut flour (mg) as per Bock’s criteria.9 Mean + SEM; Mann-Whitney U tests; ***P < .0005; **P < .005; *P < .05.

