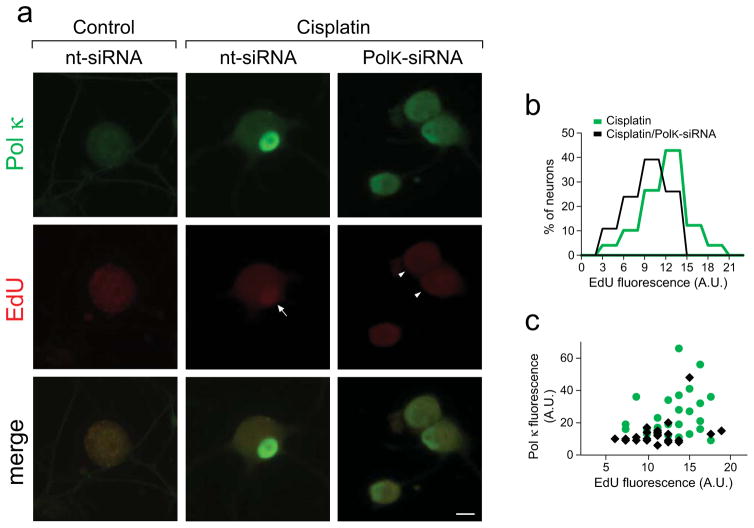
Fig. 4. Cisplatin-induced DNA repair synthesis is diminished by siRNA mediated knockdown of Pol κ levels in DRG neurons.
(a) Representative images of cisplatin induced Pol κ immunofluorescence (green) and nuclear incorporation of EdU (red, arrow). Cisplatin-induced Pol κ immunoreactivity and EdU intensity are reduced in DRGs transfected with PolK-siRNA (right panel, arrowheads), scale bar, 10 μm. (b) Mean EdU intensities of individual nuclei are shown as frequency histograms; at least 50 nuclei were analyzed per condition and data were pooled from 3 independent biological experiments (A.U., arbitrary units). EdU signal in non-exposed control cultures did not reach the positivity cutoff (not shown). (c) Scatter plot of EdU fluorescence and Pol κ immunofluorescence after cisplatin exposure in the presence of nt-siRNA (green dots) or PolK-siRNA (black diamonds). Dots/diamonds represent values of individual nuclei. Values from one experimental set are plotted (n=20 per condition).

