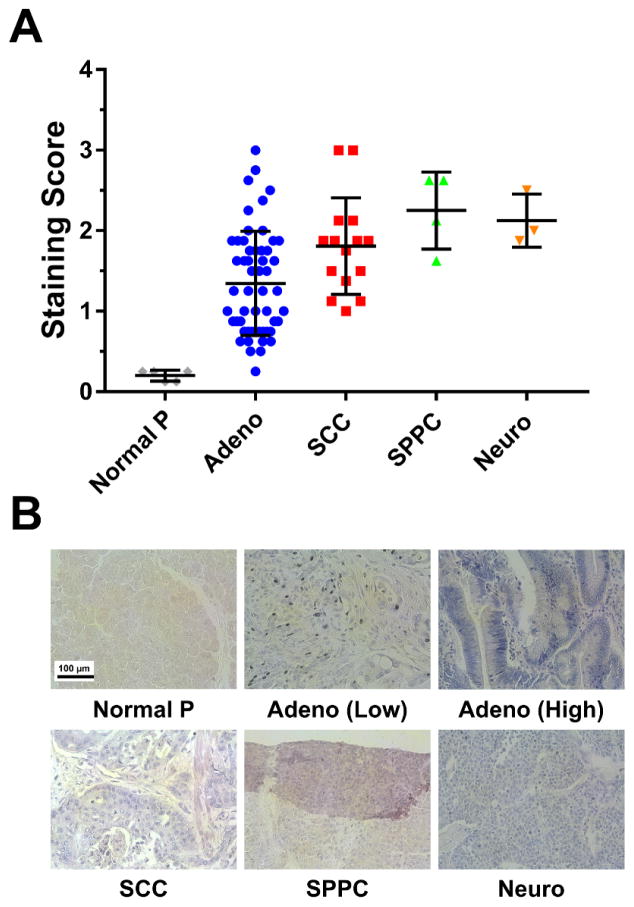
Figure 6.
Immunohistochemical analysis of TF expression in a human pancreatic cancer tissue microarray. (A) TF staining intensity scoring (range: 0 – 3) in different pancreatic cancer histological classification, and in healthy tissue. Markedly higher staining intensity scores were detected in tumor tissue compared to normal pancreas. (B) Representative stained slides for each of the tumor subtypes analyzed. TF expression is represented by the purple color. Normal pancreas: Normal P; pancreatic adenocarcinoma: Adeno; squamous cell carcinoma: SCC; solid pseudopapillary carcinomas: SPCC; neuroendocrine carcinomas: Neuro. Scale bar = 100 μm.

