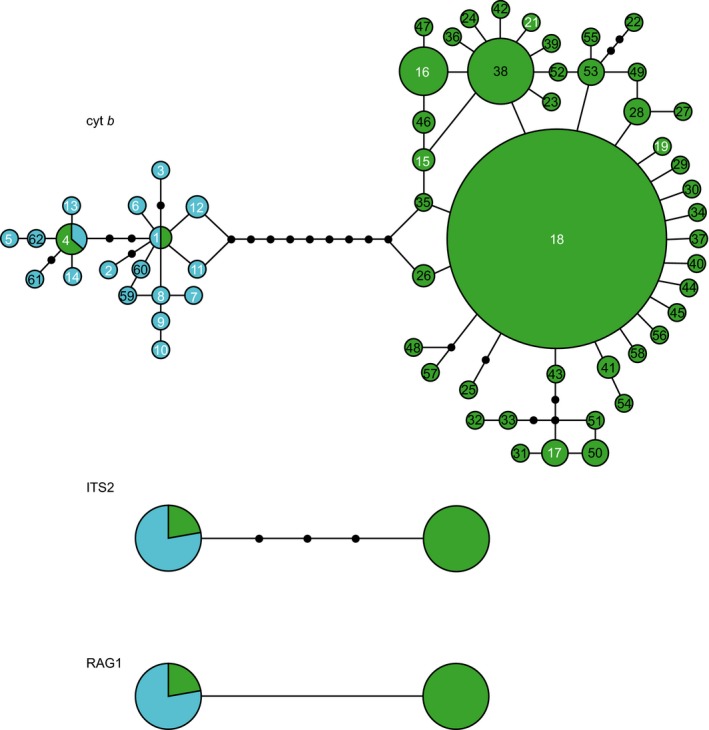
Figure 2.

Haplotype variation at cyt b, ITS2, and RAG1 loci among sampled somniosids as depicted through a 95% statistically parsimony network. For cyt b, the size of the circles is proportional to the frequency of each haplotype in the 277 individual dataset, ITS2 and RAG1 haplotypes are not scaled for frequency. Haplotype numbers correspond to Table S1, white numbers are previously reported haplotypes, black numbers are novel haplotypes to this study. Individuals identified in the field as Somniosus microcephalus possess haplotypes in green, while those identified as Somniosus pacificus possess blue haplotypes
