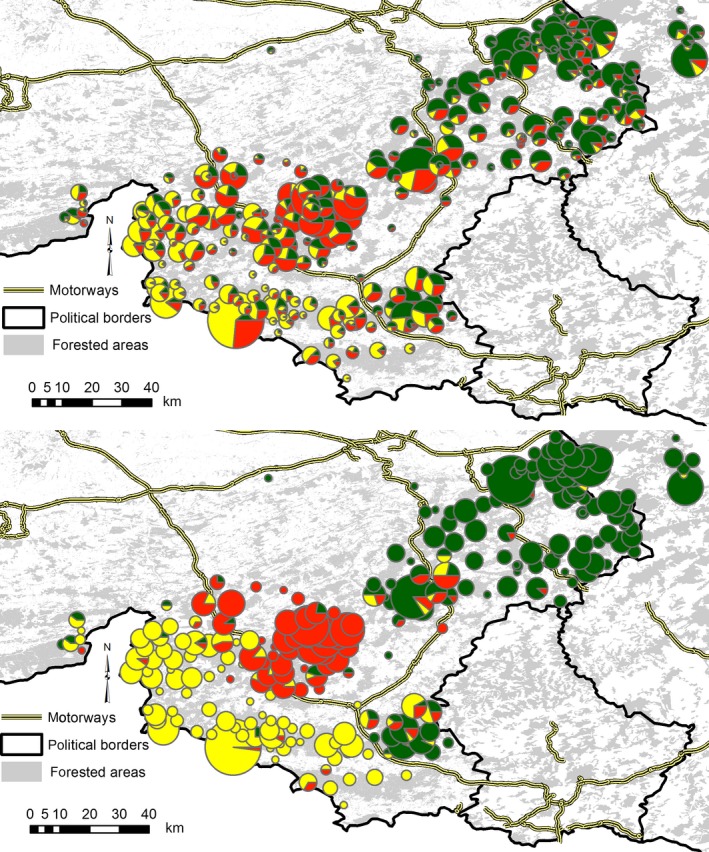
Figure 1.

Geographic origin of Belgian red deer samples included in this study and location of the genetic subpopulations inferred using the STRUCTURE (top) and spatial BAPS (bottom) algorithms. The size of the pie charts indicates the number of samples collected from a locality, whereas the pattern of the pie chart indicates the identity of the genetic clusters
