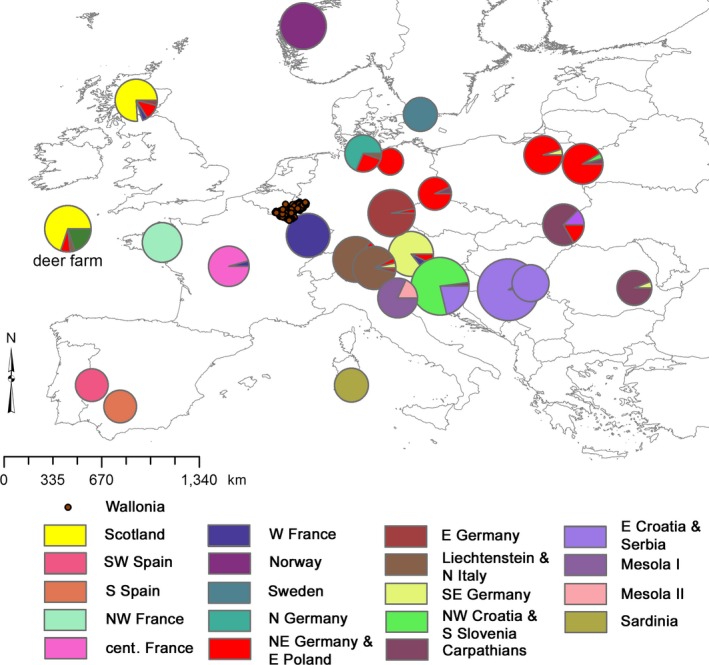
Figure 2.

Geographic location of the European red deer reference populations and composition of the genetic populations inferred using the individual‐based BAPS algorithm from Zachos et al. (2016). The size of the pie charts indicates the number of samples collected from a locality, while the pattern of the pie chart indicates the identity of the genetic clusters. “Mesola II” was excluded from the analysis as it contained only six individuals. The entire deer farm (not indicative of geographic location) was considered to be a distinct reference population although its animals were assigned to different BAPS clusters. The locations of the Walloon red deer are indicated by individual sampling locations
