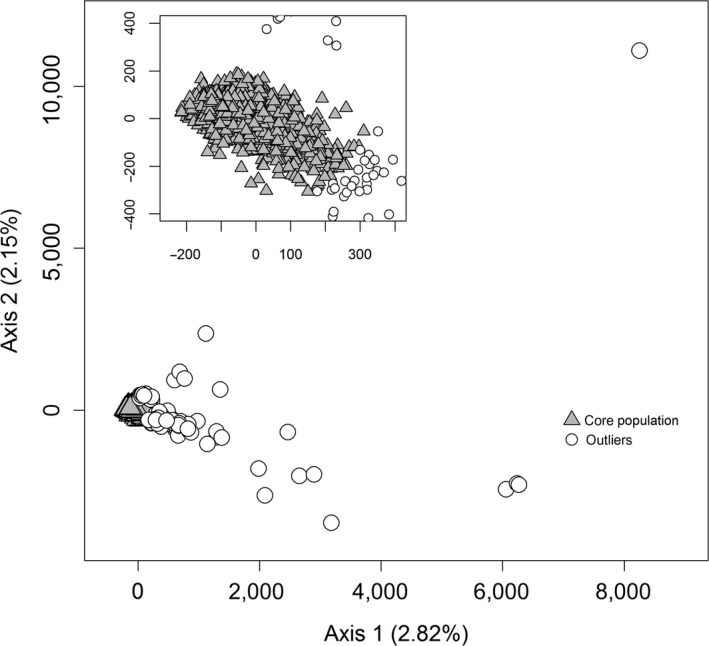
Figure 3.

Factorial correspondence analysis of Belgian red deer (N = 1,780). The analysis was based on 13 microsatellite loci. The 89 (5%) outliers were identified using a harmonic mean method. The percentage of the total variation explained by each of the two axes is given. The inset magnifies the interface between the core population and the outliers
