Figure 5.

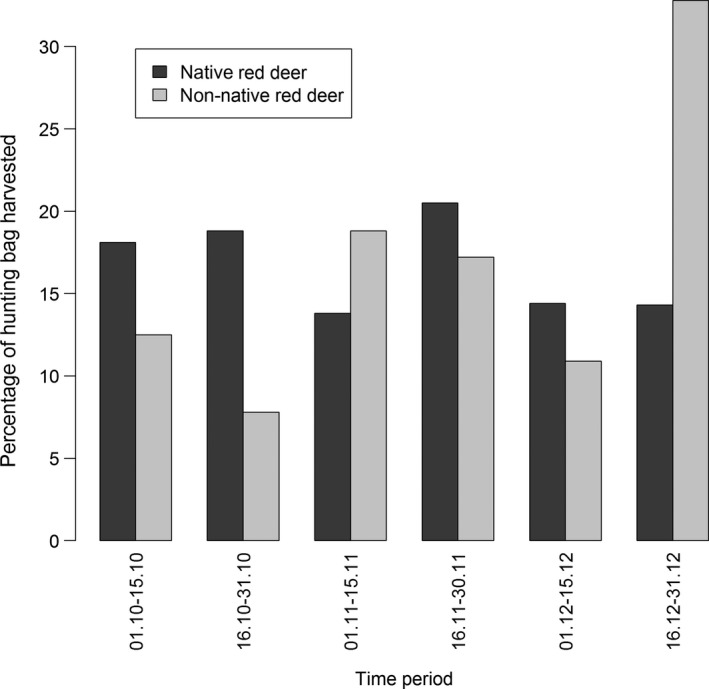
Distribution of harvest dates for studied red deer. Data included animals harvested between 2003 and 2009. Graph based on 1,638 native and 64 non‐autochthonous animals for which harvest dates were available

Distribution of harvest dates for studied red deer. Data included animals harvested between 2003 and 2009. Graph based on 1,638 native and 64 non‐autochthonous animals for which harvest dates were available