
Figure 2.
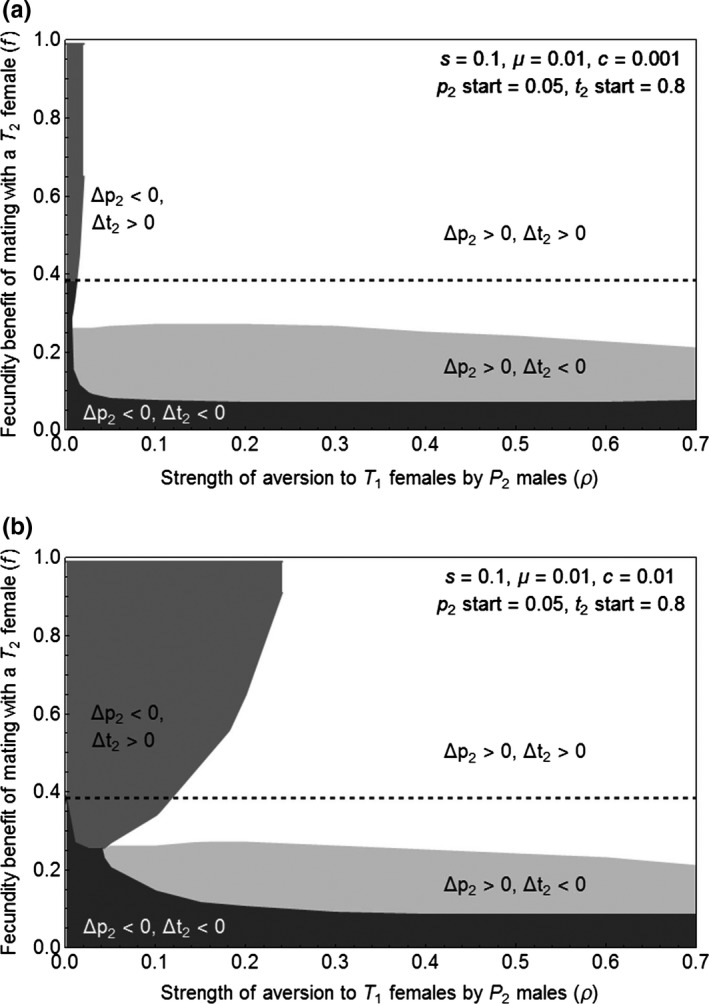
A cost of the preference reduces the size of the region in which the preference and trait allele increase, but this region (shown in white) still occurs. Displayed are results for cost of preference (panel a), and cost of preference (panel b). As in Figure 1, in both panels, the dashed line indicates the threshold value of above which the trait frequency increases in the absence of the preference allele, and is the lowest value of in the simulations