Figure 2.

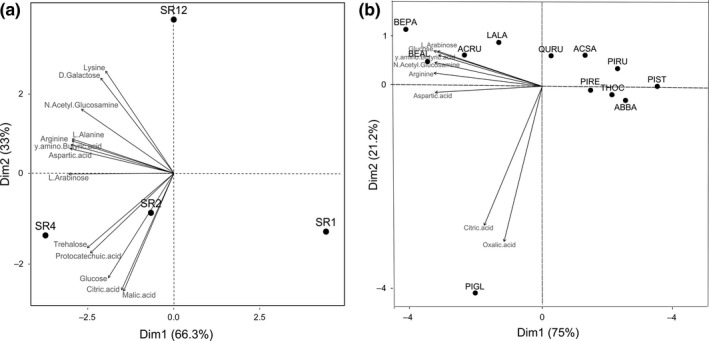
(a) Biplot of the principle components analysis based on the community‐level physiological profiles (CLPP) measurements of the different soils sampled: ordination of four tree species richness levels, and correlation plot between the PCA axes and the 13 different substrates catabolized that best explained the variations. (b) Biplot of the principle components analysis based on CLPP measurements of the different soils sampled: ordination of twelve tree monocultures, and correlation plot between the PCA axes and the eight different substrates catabolized that best explained the variations. SR1 (monocultures), SR2 (two‐species mixtures), SR4 (four‐species mixtures), and SR12 (all twelve species together). ABBA (Abies balsamea), ACRU (Acer rubrum), ACSA (Acer saccharum), BEAL (Betula alleghaniensis), BEPA (Betula papyrifera), LALA (Larix laricina), PIGL (Picea glauca), PIRU (Picea rubens), PIRE (Pinus resinosa), PIST (Pinus strobus), QURU (Quercus rubra), THOC (Thuja occidentalis)
