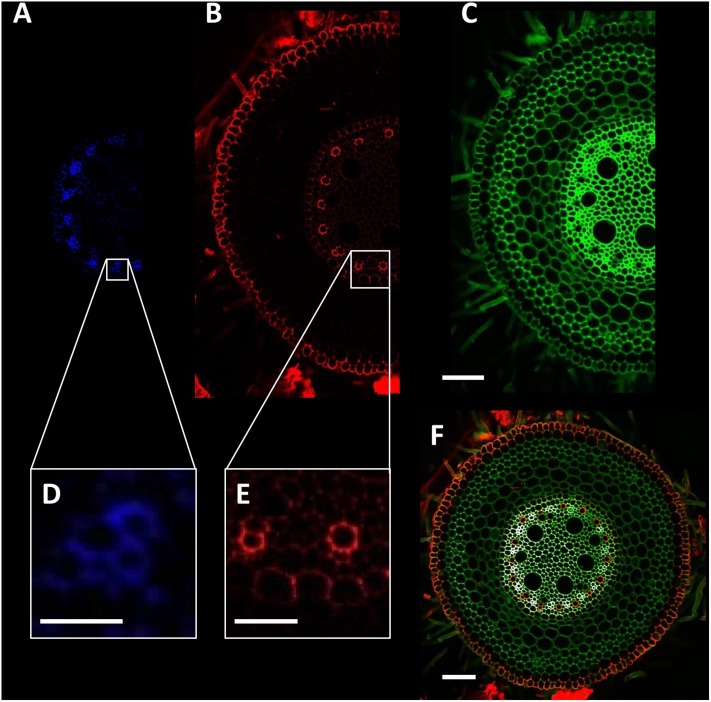
FIGURE 3.
Detection of wheat root cellular features. (A,D) Phloem poles identified using excitation with the 408 nm laser and detection through a 450/35 filter. (B) Autofluorescence signal collected using the 488 nm laser and 605/75 filter. (C) Total cell wall image collected using 408 nm laser and 515/30 filter. (E) Xylem poles and Casparian strip formation. (F) Composite image of blue (A), red (B), and green (C) channels. Scale bars (A–C,F) = 100 μm, (D) = 25 μm, (E) = 50 μm.

