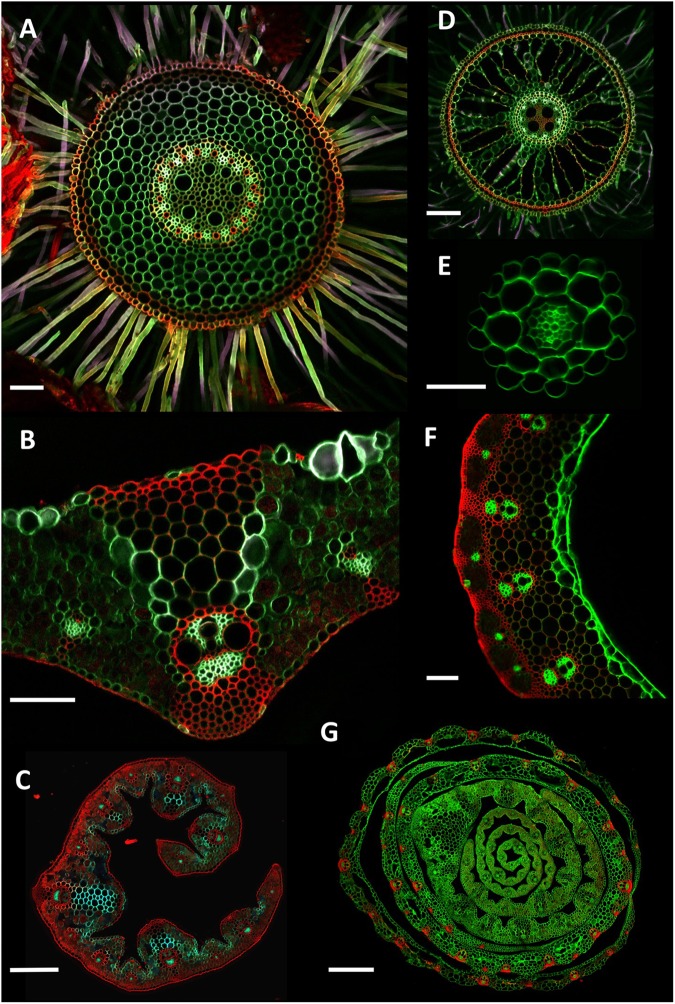
FIGURE 4.
Example cross section images. (A) Wheat (Triticum aestivum) cv. Savannah mature adventitious root grown in soil. Collected 5 cm from stem, 250 μm thick. (B) Wheat cv. Paragon flag leaf central vein, 150 μm thick. (C) Thinopyrum ponticum leaf, 150 μm thick. (D) Rice (Oryza sativa) adventitious root grown hydroponically. Collected 10 cm above the root tip, 150 μm thick. (E) Arabidopsis thaliana primary root grown on an agar plate. Collected 5 cm from the root tip, 100 μm thick. (F) Wheat cv. Paragon stem. Sample collected 2 cm under ear at anthesis, 250 μm thick. (G) Wheat cv. Paragon seedling stem. Collected 4 cm above soil level, 200 μm thick. For (C,G), due to the size of the samples, overlapping sub-images were collected and stitched together using Autostitch software. Scale bars (A,B,D,F) = 100 μm, (E) = 50 μm, (C) = 300 μm, (G) = 700 μm.

