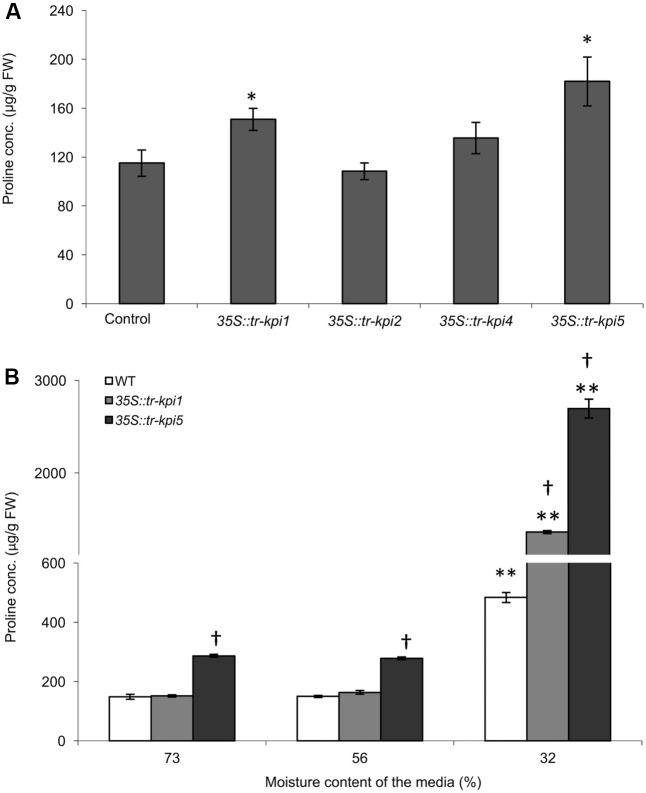
FIGURE 4.
Accumulation of proline in Tr-KPI RNAi lines under well-watered conditions and during PS treatment. (A) Accumulation of proline in the RNAi lines. Each value represents the mean of four genetically independent lines (Values of individual lines shown in Supplementary Figure 4) (n = 4 for control, 35S::tr-kpi1, 35S::tr-kpi2 and 35S::tr-kpi5; n = 3 for 35S::tr-kpi4). ∗Indicate statistically significant values in comparison with the control group (P < 0.05). (B) Proline accumulation under the PS treatment. Each value represents the mean ± SE, of three biological replications where each biological replication includes pooled tissue from four genetically independent lines. ∗∗Indicates statistically significant (P < 0.01) difference against the initial moisture content of the media. †Indicates statistically significant (P < 0.01) difference in the PS treatment in comparison with the control group using Student’s t-test.

