
Figure 5.
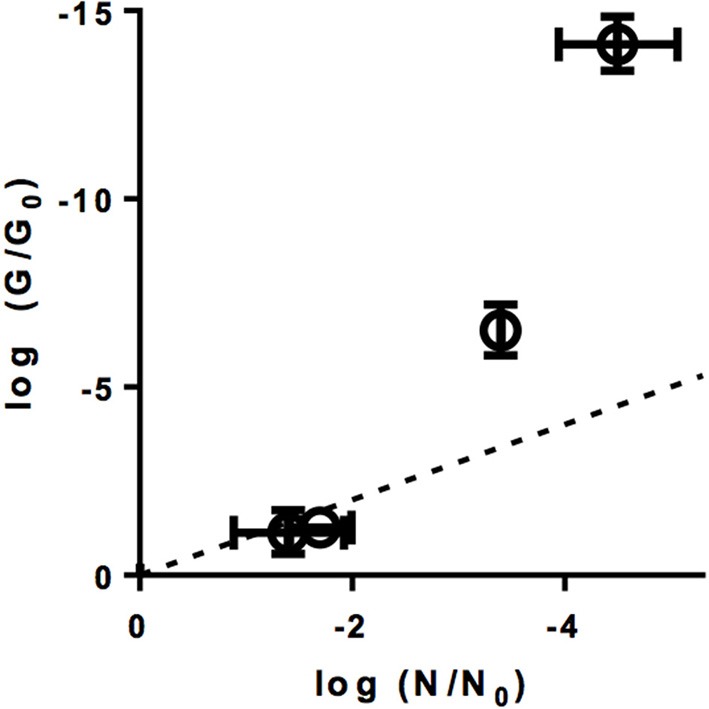
Genome loss log(G/G0) at different levels of inactivation log(N/N0) by ClO2. The dotted line represents the 1:1 correlation between inactivation and genome loss. Errors bars represent the MPN enumeration error (horizontal) or the standard deviation associated with G/G0 (vertical) (Ku, 1966).