
Figure 6.
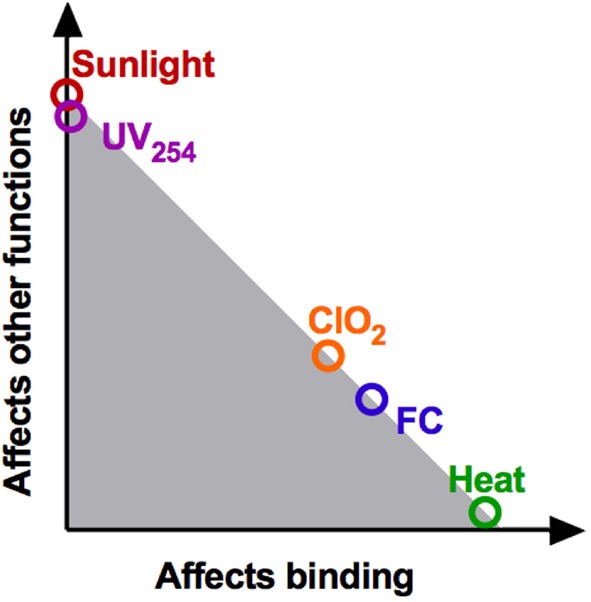
Schematic summary of the contributions of binding loss and other viral functions to overall inactivation. This location of the data points correspond to the ratio of log(N_b/N_b0): log(N/N0) (see Figure 4D). The shaded region represents the additive effects of loss of binding, genome replication and potentially other functionalities.