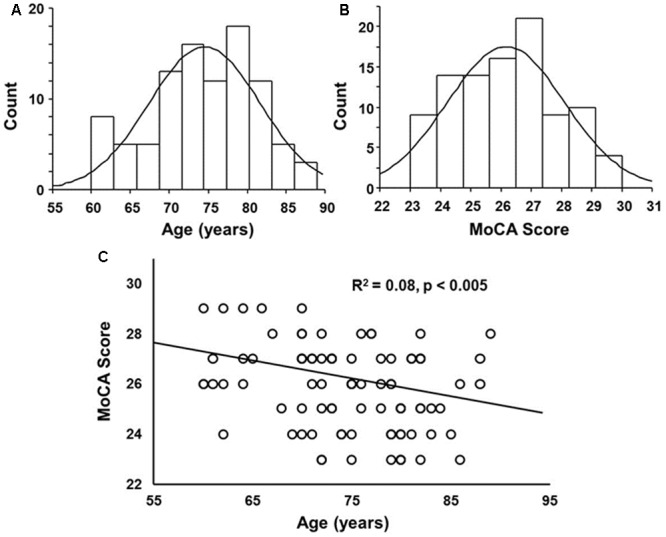
FIGURE 1.

Histograms of the distribution of (A) ages and (B) Montreal Cognitive Assessment (MoCA) scores overlaid with a normal distribution curve based on the mean and SD. (C) A correlation was observed between age and MoCA score, such that the MoCA score decreased with increasing age.
