FIGURE 3.

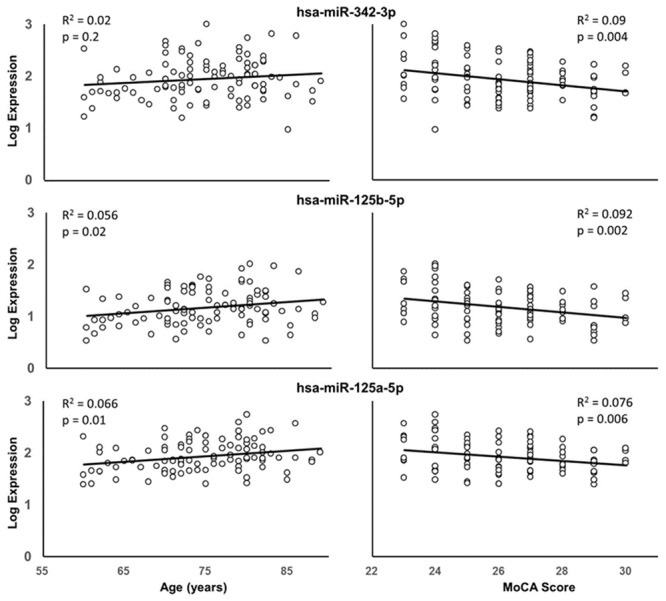
Correlation of hsa-miR-342-3p (top), hsa-miR-125b-5p (middle), and hsa-miR-125a-5p (bottom) expression with age (left) or MoCA scores (right). The R2 and p-values for the simple regressions are provided.

Correlation of hsa-miR-342-3p (top), hsa-miR-125b-5p (middle), and hsa-miR-125a-5p (bottom) expression with age (left) or MoCA scores (right). The R2 and p-values for the simple regressions are provided.