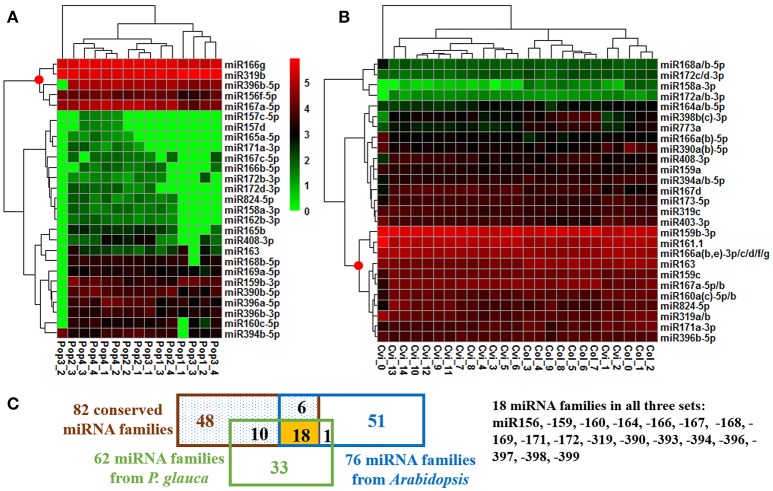
Figure 4.
Temporal expression pattern of top conserved miRNAs in P. glauca and Arabidopsis. We used hierarchical clustering of 27 most abundant conserved miRNAs and seed developmental phases in (A) P. glauca and (B) Arabidopsis. The color key alludes to the relative expression level: green- low, black- medium and red- high corresponding to the ranges (log2-transformed RPM) of [0, 625000] and [0, 536276] for P. glauca and Arabidopsis, respectively. A red dot at the node for miRNA clustering indicates highly expressed miRNAs in P. glauca and Arabidopsis, respectively. An underscore line links population number to P. glauca seed-set phase (e.g., “Pop1_1” means Population 1 at seed-set timepoint 1, and so forth) or ecotype to Arabidopsis seed-set phase (e.g., “Cvi_1” denotes Cvi-0 at timepoint 1, and so forth). In (C) miRNA family Venn diagram, the “82 conserved miRNA families” across Tracheophyta species are from Chávez Montes et al. (2014).

