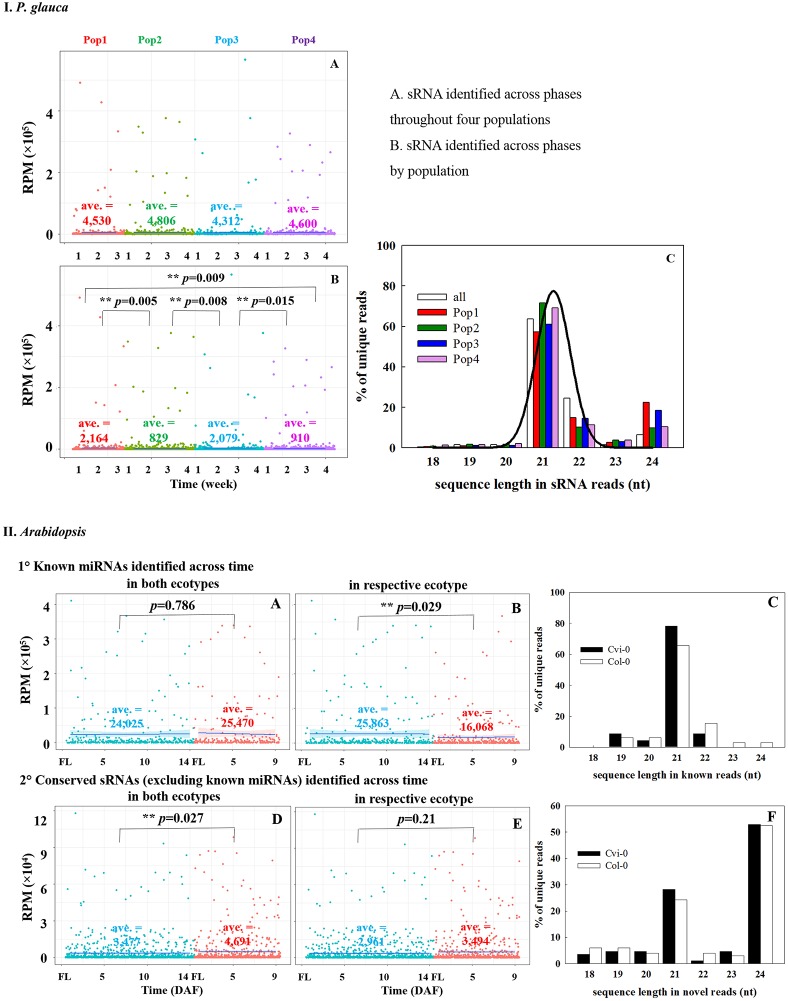
Figure 5.
Comparison of expression abundance and pattern of sRNAs identified across seed developmental phases throughout or by populations in P. glauca (IA–C) and Arabidopsis (IIA–F). The normalized average expression is given within each panel (i.e., ave.). **p-value < α (= 0.05) using Student's t-test.

