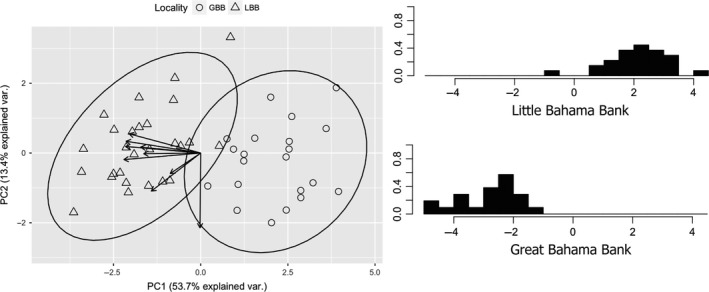
Figure 7.

Principal components analysis (left) indicates that the Great Bahama Bank (GBB) and Little Bahama Bank (LBB) individuals tend to be different from each other. Vectors pointing toward the PC2 axis represent skull measurements, and the single vector pointing to the PC1 axis is the forearm measurement. Discriminant function analysis (right) also shows differentiation between the Great and Little Bahama Bank, with the exception of one individual from the Little Bahama Bank
