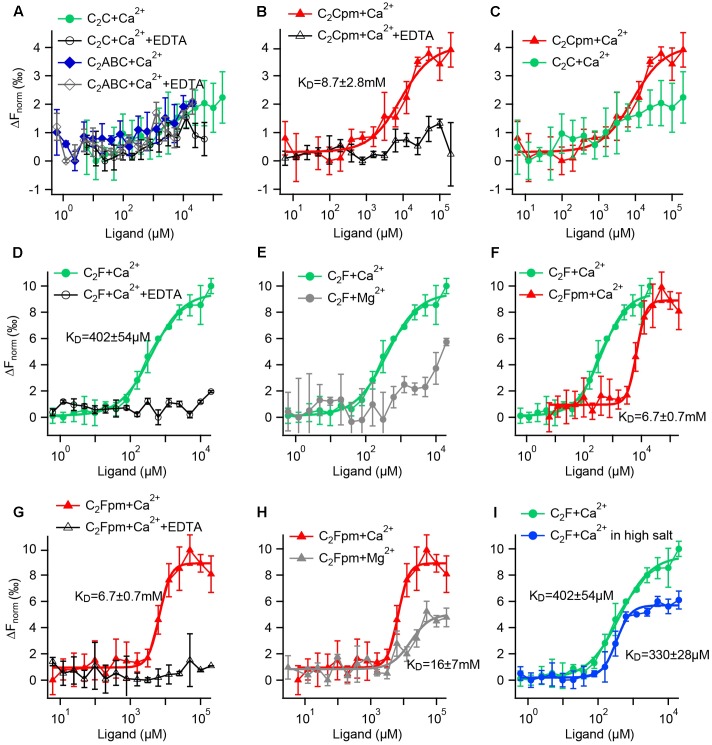
FIGURE 9.
Microscale thermophoresis (MST) assays reveal that phosphorylation increases the Ca2+ affinity of the C2C domain and reduces the Ca2+ affinity of the C2F domain. (A–I) Fluorescence changes after infrared laser mediated heating of the sample indicate binding of a ligand. Data points are mean values ± SD for n = 3 technical replicates each. KDs were acquired by Hill fitting (solid lines) in IGOR (Wavemetrics). (A) A minor change in fluorescence for the C2C domain or a fragment containing the C2ABC domains did not differ from the negative controls with EDTA, suggesting no Ca2+ binding. (B) In contrast, the phosphomimetic (pm) C2C domain (T449D) showed binding to Ca2+, but with rather low affinity. (C) Direct comparison for the wild-type and the phosphomimetic C2C domain illustrates that phosphorylation increases the Ca2+ affinity. (D) The wild-type C2F domain binds to Ca2+; but not when EDTA was present. (E) In comparison, the binding of Mg2+ to the C2F domain is much weaker than the binding to Ca2+. (F) Compared to the non-phosphorylated C2F domain, the three phosphomimetic mutations lower Ca2+ affinity by one order of magnitude; (G) no binding occurred in the presence of EDTA. (H) Mg2+ affinity is lower than Ca2+ affinity for the phosphomimetic C2F domain. (I) Measuring in a high salt buffer (300 mM NaCl) slightly lowers the KD for Ca2+.

