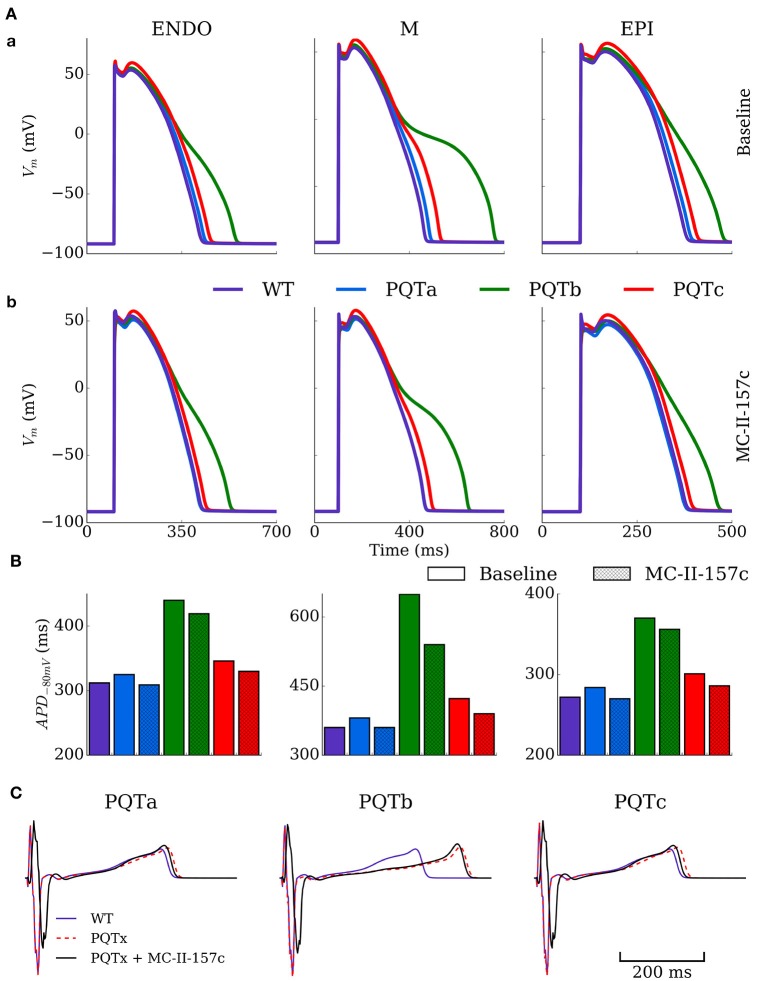
Figure 4.
Action potential and ECG morphology and duration in PQT and MC-II-157c. (A) Action potentials for the three cell types (ENDO, left; M, middle; EPI, right) under baseline (upper) and MC-II-157c (lower) conditions in control (WT, purple) and PQTa-c conditions (blue, green, red) in the spatial cell model. (B) Action potential duration at −80 mV for the same conditions in (A). The colors in the key apply to both panels (A,B). (C) Computed ECGs for the three conditions (dotted red line) and with the application of MC-II-157c (black line), relative to the WT (purple line). MC-II-157c was modeled as IKr modification + 40% INa block. Any impact of INa block on the upstroke velocity is not clear at this scale.

