Figure 6.
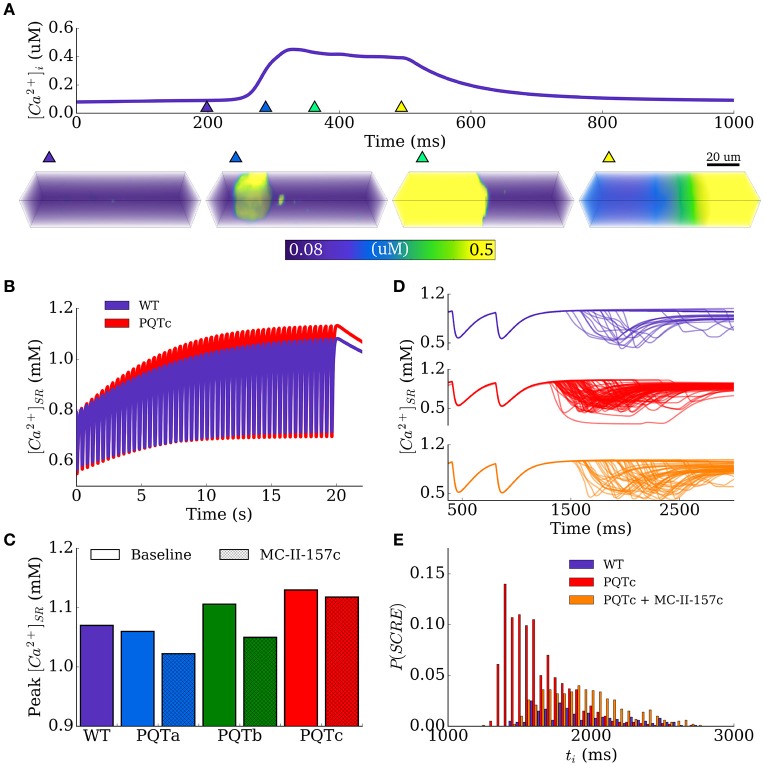
SR Ca2+ loading and spontaneous Ca2+ release events. (A) Example of a whole-cell spontaneous Ca2+ release event (Ca2+-wave), using the spatial model of stochastic intracellular Ca2+ handling, showing the Ca2+ transient (upper) and snapshots of Ca2+ concentration in the 3D cell volume (lower). The triangular makers in the upper panel indicate the timings of the snapshots in the lower panel. (B) Time-series of SR-Ca2+ during the SR-loading protocol, shown for control (WT, purple) and PQTc (red). (C) Peak SR-Ca2+ during the loading protocol for all conditions. (D) Examples of spontaneous release resulting from SR-loading for control (WT, purple), PQTc (red) and PQTc + MC-II-157c (orange). 100 simulations of each conditions are shown to indicate variation in spontaneous release. (E) Distributions of initiation time of spontaneous release events, corresponding to the same conditions shown in (D). The time is relative to the start of the simulation (3 beats, initial conditions of dynamic steady state) to align with (D). MC-II-157c was modeled as IKr modification + 40% INa block.

