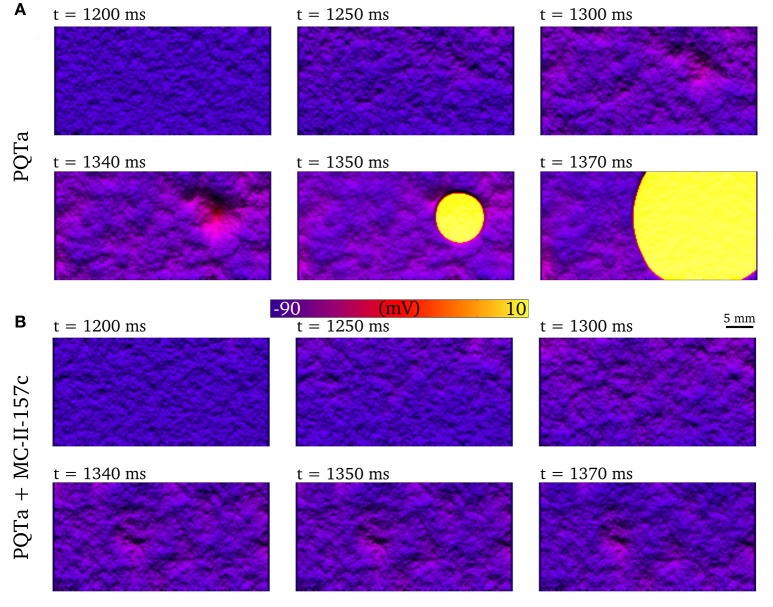
Figure 8.
Development of premature excitation in 2D tissue sheets. Temporal snapshots of the membrane voltage in a 2D slice of tissue during spontaneous Ca2+ release events for PQTa (A) and PQTa + MC-II-157c (IKr modification + 40% INa block, (B). The color bar has been scaled to emphasize voltage differences in the DAD region and lighting has been added to further enhance local variation in voltage. Data corresponds to ti width of 550 ms and duration median 150 ms.

