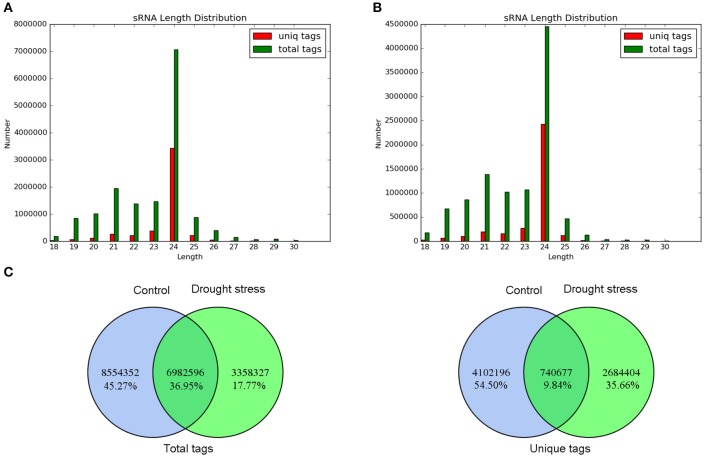
Figure 2.
Sequence analysis of small RNAs. (A) Length distribution of small RNAs under control. (B) Length distribution of small RNAs under drought stress. The distributions of total tags and unique tags are shown as numbers. (C) Venn diagram of common and specific sequence statistics between control and drought stress. Total tags and unique tags are shown in the left and right panels, respectively.

