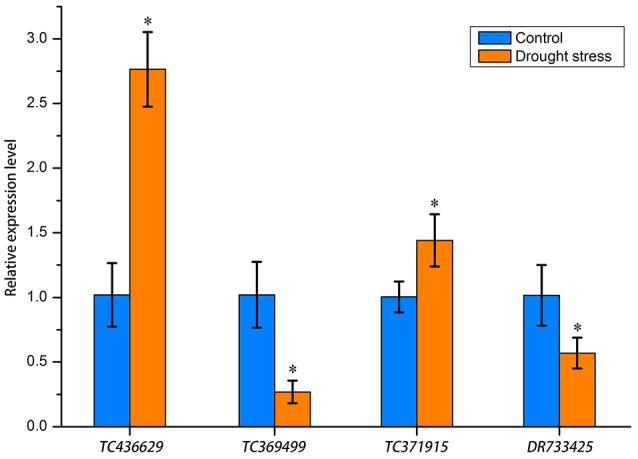
Figure 8.

Relative expression levels of four miRNA target genes determined by RT-qPCR. Gene expression levels were normalized against the internal control gene Ta54825. Asterisks between the control and drought stress indicate significant difference at p < 0.05 as determined by t-test. Means were calculated from three replicates.
