Figure 9.
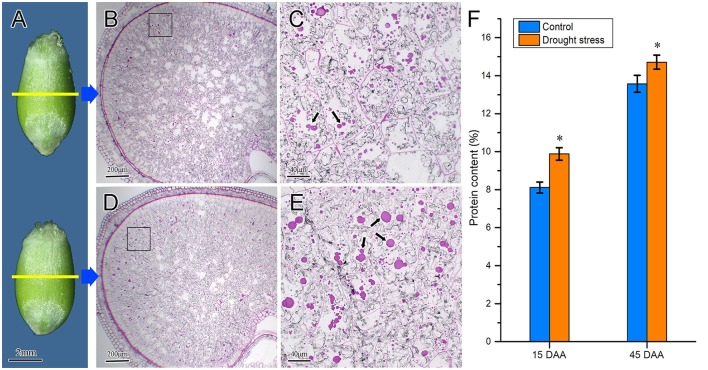
Difference of protein body accumulation in wheat endosperm under control and drought stress conditions. (A) Wheat caryopsis profile. The caryopses at the top and the bottom represent control and drought stress conditions, respectively. (B,C) Microstructure of wheat endosperm under control condition; (D,E) microstructure of wheat endosperm under drought stress. Subpanels (C,E) are high-magnification views of the black boxes in subpanels (B,D), respectively. Black arrows in the figures indicate protein bodies. (F) Protein contents of wheat caryopsis at 15 and 45 DAA under drought stress. Data are expressed as means from three individual biological replicates. Asterisks above the histogram indicate a significant difference at p < 0.05 as determined by t-test. Scale bars: (A) 2 mm, (B,D) 200 μm, and (C,E) 40 μm.

