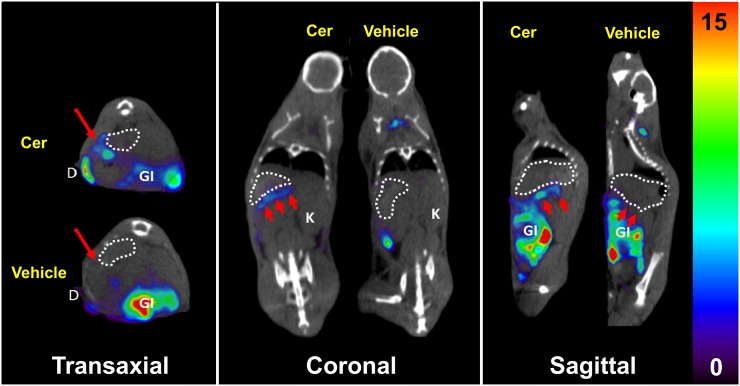
FIGURE 1.
125I-iodo-DPA-713 SPECT/CT of treated (Cer) and control (vehicle) mice. Coregistered images show radiotracer uptake in inflamed pancreas (arrows) and duodenum of treated mouse but not in either tissue of control mouse. Stomach is delineated by dotted circles. Gastrointestinal uptake of radiotracer is specific for peritoneal macrophages. Scale unit is %ID/g. D = duodenum; GI = gastrointestinal tract; K = kidney.

