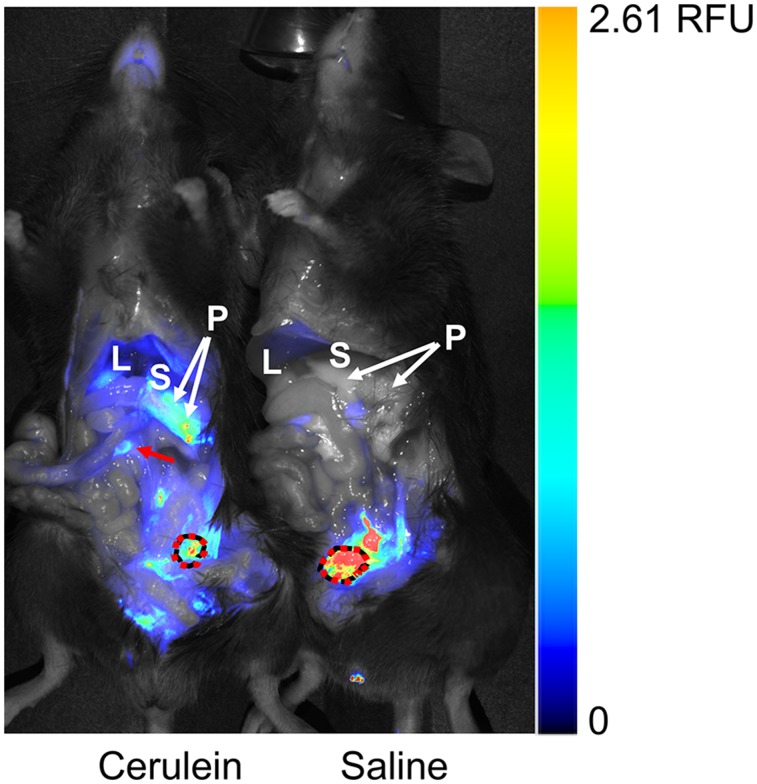
FIGURE 4.
Ex vivo near-infrared fluorescence imaging of DPA-713-IRDye800CW in treated (cerulein) and control (saline) mice. Fluorescent tracer uptake is seen in pancreas, gastrointestinal tract (arrow), and urinary bladder (dotted circle) of treated mouse but in only urinary bladder of control mouse. Adjacent stomach is labeled for context. Color bar is relative fluorescence units (RFU). L = liver; P = pancreas; S = stomach.

