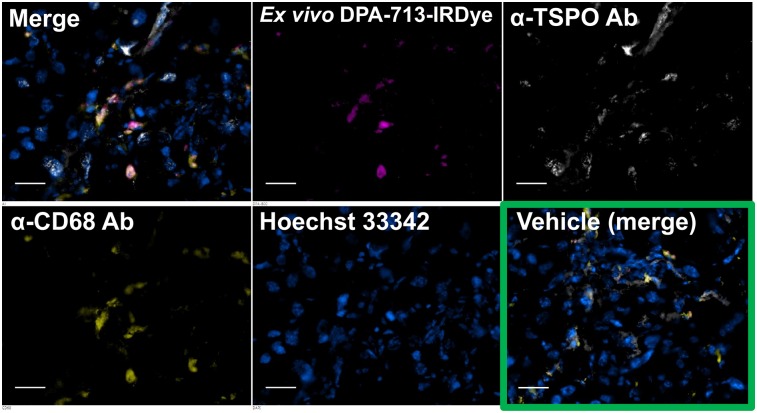
FIGURE 5.
Ex vivo near-infrared fluorescence microscopy of DPA-713-IRDye800CW in pancreatic sections from mice in Figure 4. Separate and merged images are shown for treated mouse, whereas only merged image is shown for control mouse (vehicle). Treated pancreas has abundant fluorescent tracer uptake (magenta) in CD68-positive phagocytic cells (yellow) along with abundant TSPO expression (white), whereas control pancreas has almost no phagocytic cells present, small amounts of TSPO expression, and no visible fluorescent probe uptake. Scale bar = 50 μm. Ab = antibody.

