
Figure 1.
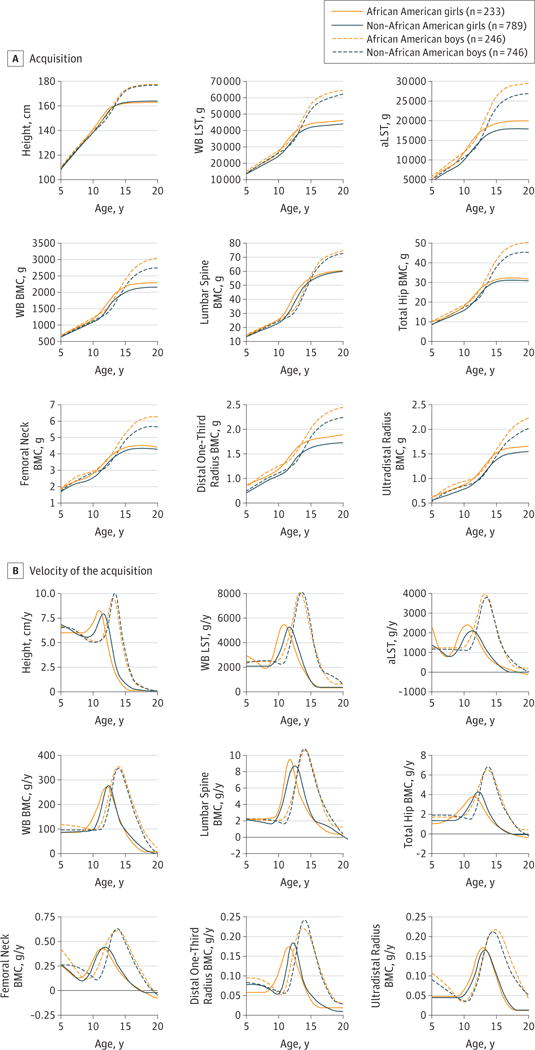
Acquisition of Height, Bone, and Soft Tissue With Age, by Sex and Self-reported Race, From the Mean Curves Modeled Using SITAR (Superimposition by Translation and Rotation)
A, The SITAR-derived mean curves for the magnitude of acquisition of each growth parameter with increasing age are shown, stratified by sex and race. B, The SITAR-derived mean curves for the velocity of acquisition of each growth parameter with increasing age are shown, stratified by sex and race. In B, the horizontal black line indicates zero velocity (ie, neither gain nor loss). aLST indicates appendicular lean soft tissue;
BMC, bone mineral content;
WB, whole body; and
WB LST, whole-body lean soft tissue.