Figure 6.
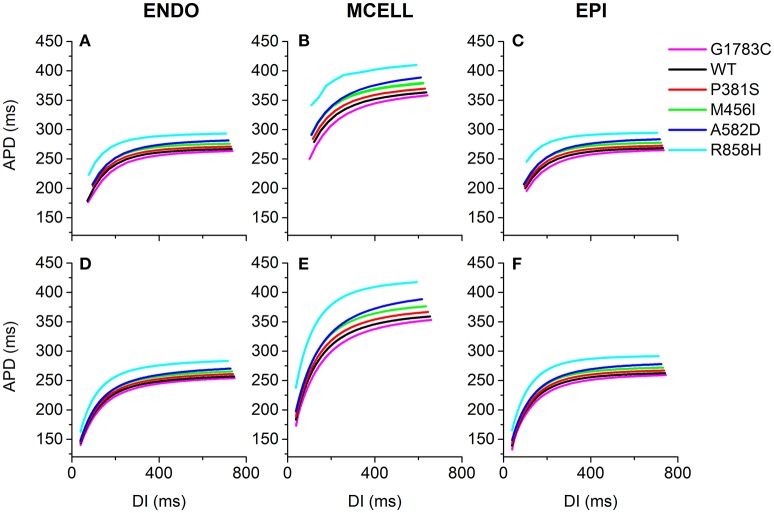
Single-cell action potential duration (APD) restitution (APDR) curves for the Ten Tusscher-Panfilov (TP06) human ventricular cell model. (A–C) APDR curves obtained using a dynamic restitution protocol for the endocardial (ENDO), epicardial (EPI) and midmyocardial (MCELL) cells in the G1783C (Magenta), wild-type (WT, Black), P381S (Red), M456I (Green), A582D (Blue), and R858H (Cyan) conditions. (D–F) Similar dynamic restitution curves as in (A–C), but these APDR curves obtained using a S1-S2 restitution protocol for a pacing cycle length (PCL) of 1,000 ms for the six different settings. APD is plotted against diastolic interval (DI). For each cell type, curves from bottom to top are for the G1783C mutation, for the WT condition, for the P381S mutation, for the M456I mutation, for the A582D mutation and for the R858H mutation, respectively. Among in these mutations, the R858H mutation obviously shifts APDR curves upwards.

