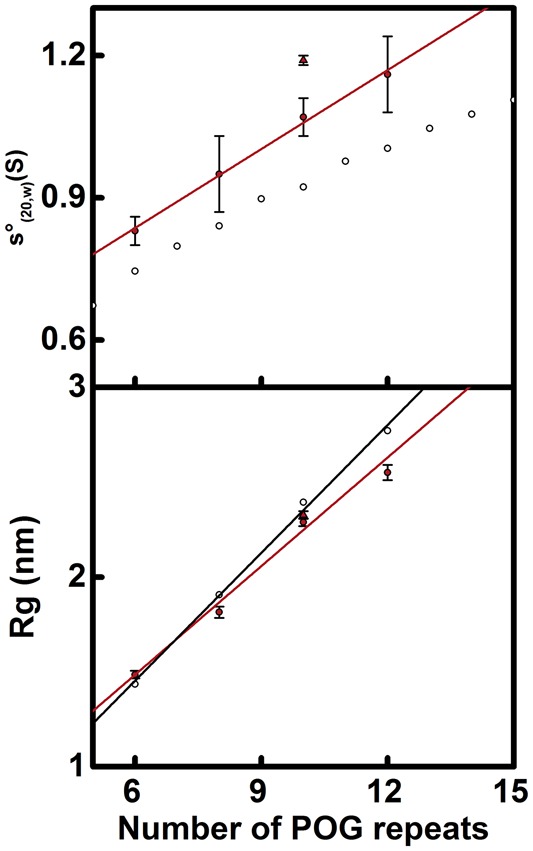
Figure 2. Comparison of experimental and crystallographic s(20,w) and Rg values.

The top panel compares s20,w values against peptide length. The filled circles represent the experimental values for (POG)6, (POG)8, (POG)10 and (POG)12. (POG)10unblocked is represented by a filled triangle. The four unblocked peptides were fitted with a red line. The open circles represent the theoretical values for linear (POG)5-(POG)15 crystal-derived models. The bottom panel compares the Rg values against peptide length. The filled red circles represent the experimental Rg values for the four collagen peptides (POG)6-12 and were fitted by a red line. (POG)10unblocked is represented by a filled triangle. The open circles represent Rg values calculated from linear crystal-derived models and were fitted by a black line.
