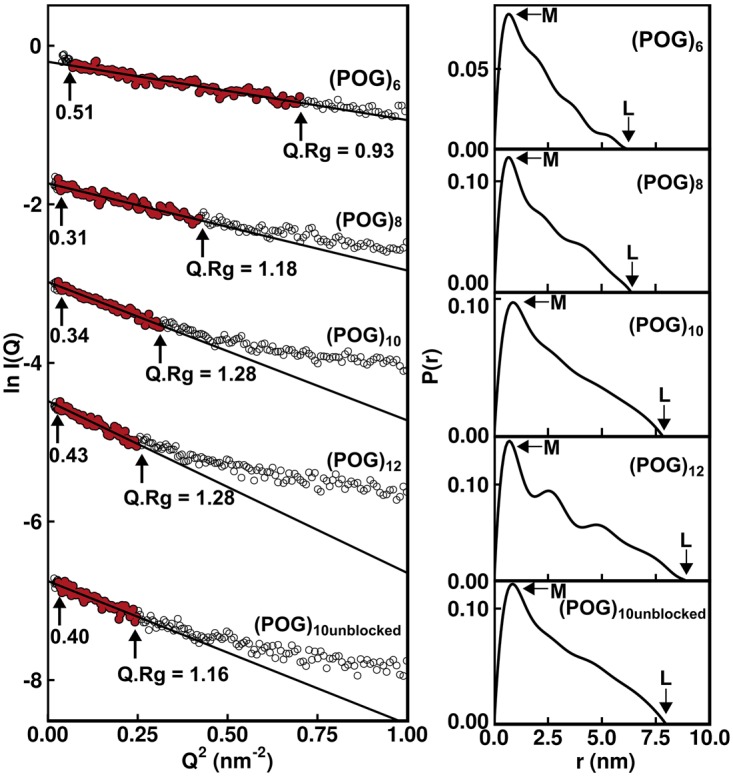
Figure 3. Experimental X-ray Guinier and P(r) analyses for the five collagen peptides.

The Guinier radius of gyration Rg plots at low Q values are shown on the left for five collagen peptides (POG)6-12 at concentrations of 0.8–1.0 mg/ml. The data points in red were fitted by best-fit lines which were used to calculate the Rg values. For these, the Q ranges were 0.26–0.84 nm−1 for (POG)6, 0.17–0.65 nm−1 for (POG)8, 0.17–0.56 nm−1 for (POG)10, 0.17–0.50 nm−1 for (POG)12 and 0.17–0.50 nm−1 for (POG)10 unblocked. The Q.Rg ranges are shown with each fit. The vertical axis is measured in arbitary units of ln I(Q). The right-hand panel displays the pair distribution analyses P(r) calculated from the experimental scattering curves. The r values of the maxiumum at M were 0.65 nm for (POG)6, 0.70 nm for (POG)8, 0.97 nm for (POG)10, 0.71 nm for (POG)12 and 0.88 nm for (POG)10unblocked. The maximum length L values were 6.5 nm for (POG)6, 6.4 nm for (POG)8, 7.8 nm for (POG)10, 8.9 nm for (POG)12 and 8.0 nm for (POG)10unblocked.
